It’s easy to look at low LMS completion rates and decide your platform isn’t working.
But when people are quick to write off this data as meaningless, they often miss what it’s really telling them.
You hear it a lot, that nobody uses the LMS, that it’s not how people learn in the real world.
And once that view takes hold, people stop looking for nuance.
They dismiss the platform, the content, and the whole system based on a single metric.
But that metric might still matter. You just need to ask better questions about it.
The broader context for digital learning continues to shift rapidly. As AI, mobile access, and social learning gain traction, the way people interact with learning content is changing too. Before jumping to conclusions about low engagement, it’s worth understanding the wider picture:
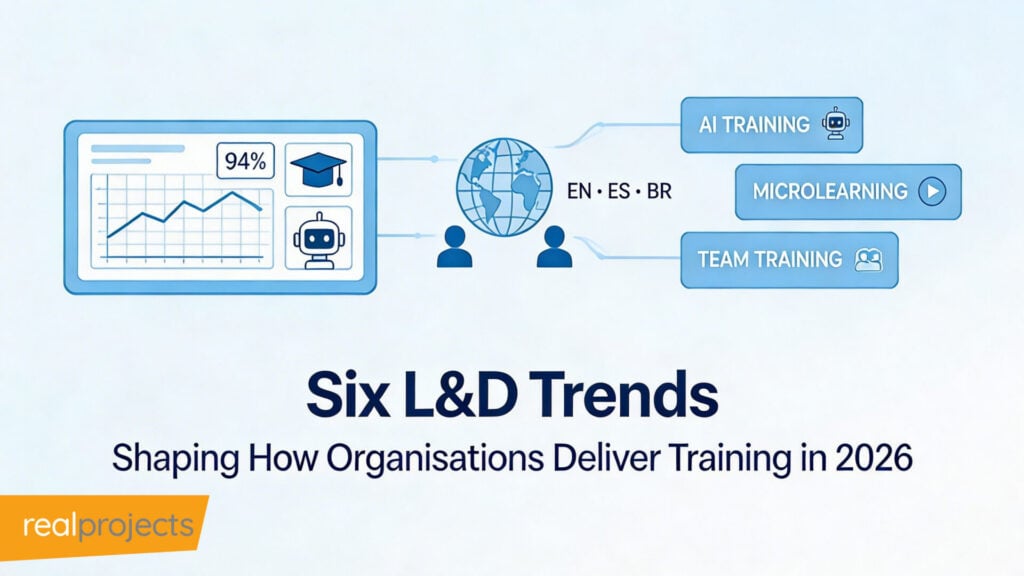
- AI in L&D: 30% of L&D teams are already using AI-powered tools, and 91% plan to increase usage in 2024. (Source: eLearning Industry, 2024)
- Corporate elearning: 98% of corporations planned to implement eLearning by 2023. (Source: eLearning Industry, 2024)
- Retention Impact: 94% of employees say they would stay longer at a company that invests in their development. (Source: eLearning Industry, 2024)
- Social Learning: Introducing social learning can increase completion rates by up to 85%. (Source: Growth Engineering, 2024)
- Microlearning: 85% of organisations now use video-based microlearning. (Source: eLearning Industry, 2024)
This data underlines the complexity of learning behaviours and the importance of looking beyond surface-level metrics.
Why LMS Completion Rates Get Misunderstood and What You Might Miss
There’s a reason some employees aren’t engaging. And it’s not always because the content is bad.
Sometimes it’s the platform that’s clunky. Sometimes it’s a lack of clear learning journeys. And sometimes it’s about privacy. If you’re a manager looking for a quick answer to an email etiquette question, do you really want that recorded in your learning profile? Probably not.
But most organisations don’t think about that. They just see the numbers and label them useless.
There’s a bigger point here, one that rarely gets discussed. If people know they’re being tracked, they may avoid engaging altogether.
Especially when the content feels basic, or when completing it could be interpreted as a sign of deficiency. And yet, we rarely ask how employees feel about the way their usage data is handled.
Scott Hewitt asks:
“I’m often reading about vanity metrics in LMS data. It seems to have become too easy to call them out and dismiss them. But when I’ve worked with data analysts in other sectors, they rarely single out a specific data source and write it off entirely. That mindset sends the wrong message.”
LMS Completion Rates: What Are They Really Telling You?
The truth is, you can’t evaluate LMS completion rates without context.
Low completions might point to disinterest. But they could also point to something much simpler, such as a technical problem. A browser incompatibility. A broken content object. A piece of content that stalls on mobile. Are you checking that? Are you asking the question?
Scott Hewitt asks:
“Completion rates alone won’t explain what’s really happening. Before dismissing them, ask what might be affecting the data — timing, access, localisation, or something as simple as a browser issue.”
Too often, LMS or LXP data is written off without even a basic investigation. In other fields, particularly in sport and performance analysis, metrics are rarely dismissed outright. Analysts start with the data. They treat it as a signal, a prompt, a clue to dig deeper.
It’s that mindset, using metrics as a starting point rather than a verdict, that L&D needs to embrace.
How LMS Completion Rates Fit Into a Bigger Learning Analytics Picture
Imagine a world where data forms the foundation for every decision.
Organisations across industries already use it to optimise operations, reduce inefficiencies, and uncover insight. Learning and Development teams are no exception.
With every interaction recorded, including clicks, completions, time spent, and pathways taken, the volume of available LMS or LXP data has exploded. And with it, so has the potential to make smarter, evidence-based decisions about learning.
But collecting data is just the beginning. The real power lies in interpretation. Used well, data helps L&D teams spot usage trends, identify blockers, and guide future investment. Used blindly, it risks reinforcing the wrong assumptions.
Because knowing someone didn’t complete a course tells you very little. Understanding why they disengaged is what matters. That’s where smart analysis, direct observation, and feedback need to complement the metrics.
It’s this blend of digital signal and human insight that shifts L&D from intuition to precision.
Rethink Your Metrics to Reflect Real Learning Behaviour
The other danger of dismissal is assuming that just because a metric isn’t perfect, it’s worthless. In reality, most data will give you some value. The trick is knowing how to use it, and how to combine it with other signals.
Sometimes, the answer isn’t in the system at all. It’s in how you frame learning. In whether the structure reflects how people actually want to learn. In whether the experience respects their time and doesn’t make them feel monitored or exposed.
If the data you’ve got isn’t telling you what you need to know, develop a better metric. Build something that reflects the behaviour you actually care about. But don’t pretend the existing data means nothing.
Scott Hewitt asks:
“If you’re new to LMS or LXP data, start simple. Measure a few metrics and look for trends. But crucially, get the rest of the business involved. Most teams don’t tie content usage to things like sales performance, safety incidents, customer satisfaction, or manager feedback. That’s a big missed opportunity.”
LMS completion rates might not give you the full story, but they do give you a starting point. Look at them closely. Ask why. Then look beyond them. Because the problem might not be your content. It might be the experience, the perception, or the signals people are getting from the system.
Dismiss the Data, Miss the Point
The moment you decide “no one’s using it” without asking why, you’re done. You’ve closed the loop too soon. You’ve stopped learning.
That’s when you fall into the trap of repeating the same line, that it’s all vanity. And you just keep feeding the same assumptions back into the system.
You’re not solving anything.
But if you stay curious, the data becomes a tool. It won’t give you every answer. But it will help you ask better questions. And that’s where insight begins.
Where Learning Data Strategy Goes From Here
And this is just the beginning.
With the volume of data now available in modern L&D systems, the possibilities for what you can learn and improve are growing every day. The more intelligently we analyse and apply this data, the better decisions we make. Not just about content, but about user experience, platform design, and long-term learning strategy.
Scott Hewitt asks:
“If I could change one thing, it would be this: think like an analyst. Don’t dismiss the data, look at what’s really happening. Who’s engaging? When? What are they skipping? What are they searching for elsewhere? Until you understand that, you don’t understand your own business.”
As L&D teams evolve, data-led approaches will play a bigger role in shaping what training looks like, how it’s delivered, and how it lands with different audiences. When used with care, LMS or LXP data doesn’t just reflect what’s happening. It helps create the conditions for learning to thrive.
LMS Completion Rates: FAQs and Quick Answers
Q. Is LMS or LXP data just a vanity metric?
A. Not always. Dismissing LMS completion rates too quickly can mean missing useful clues. They may reveal tech issues, timing problems, or content design flaws.
Q. Why are LMS completion rates so low?
A. It’s not always disinterest. It could be a tech glitch, poor mobile access, unclear learning paths, or even privacy concerns.
Q. Can LMS data show if learning is working?
A. Not by itself. Completion data alone doesn’t show learning success. But with feedback, performance, and engagement data, it paints a clearer picture.
Q. How can I get better insights from LMS data?
A. Start simple. Look for patterns over time. Connect course data with things like manager feedback, sales results, or support tickets. Don’t just look at completions — ask why.